
Ficheiro:Greenhouse Gas by Sector.png

Imagem numa resolução maior (1 632 × 1 632 píxeis, tamanho: 366 kB, tipo MIME: image/png)
|
|
Esta imagem provém do Wikimedia Commons, um acervo de conteúdo livre da Wikimedia Foundation que pode ser utilizado por outros projetos.
|

|
File:Greenhouse gas by sector 2000.svg é uma versão vetorial deste ficheiro. Ela deve ser usada em vez desta imagem em formato raster, se não for de qualidade inferior.
File:Greenhouse Gas by Sector.png → File:Greenhouse gas by sector 2000.svg
Para mais informações, consulte Ajuda:SVG. |
 |
Descrição do ficheiro
| Descrição |
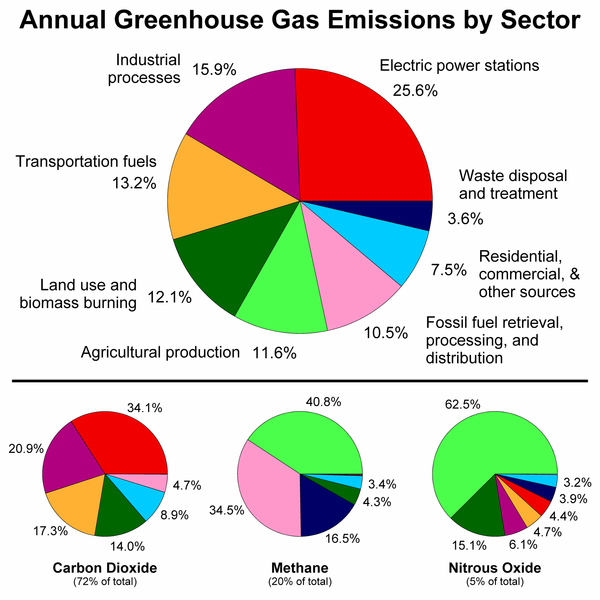
English: This figure shows the relative fraction of man-made greenhouse gases coming from each of eight categories of sources, as estimated by the Emission Database for Global Atmospheric Research version 4.2, fast track 2010 project [1]. These values are intended to provide a snapshot of global annual greenhouse gas emissions in the year 2000.
The top panel shows the sum over all anthropogenic greenhouse gases, weighted by their global warming potential over the next 100 years. This consists of 72% carbon dioxide, 20% methane, 5% nitrous oxide and 3% all other gases. Lower panels show the comparable information for each of these three primary greenhouse gases, with the same coloring of sectors as used in the top chart. Segments with less than 1% fraction are not labeled.
עברית: תמונה זו מראה את החלוקה היחסית של פליטות גזי חממה מעשה ידי אדם, על פי 8 קטגוריות של מקורות, כפי שהדבר מוערך על ידי w:Emission Database for Global Atmospheric Research version 4.2, fast track 2010 project [2].
ערכים אלו אמורים לספק תמונת מצב של שנת 2000. הפנל העליון מראה את סך הפליטות של גזי חממה כשהם נשקלים על פי פוטנציאל אפקט החממה שלהם במשך 100 השנים הבאות. זה מורכב מ 72% של he:פחמן דו חמצני, 20% he:מתאן, 5% he:תחמוצת החנקן, ו3% גזים אחרים. הפנלים התחתונים מראים את ההשוואה היחסית של כל אחד מהגזים האלה, עם אותים צבעים לסקטורים שונים כמו בפנל העליון. סמגנטים עם תרומה נמוכה מ 1% אינם מסומנים. |
| Origem | Obra do próprio |
| Autor | Robert A. Rohde |
| Outras versões |
Obras derivadas deste ficheiro: |

Licenciamento
This figure was prepared by Robert A. Rohde from publicly available data and is part of the Global Warming Art project.

|
É concedida permissão para copiar, distribuir e/ou modificar este documento nos termos da Licença de Documentação Livre GNU, versão 1.2 ou qualquer versão posterior publicada pela Free Software Foundation; sem Secções Invariantes, sem textos de Capa e sem textos de Contra-Capa. É incluída uma cópia da licença na secção intitulada GNU Free Documentation License. |
| A utilização deste ficheiro é regulada nos termos da licença Creative Commons - Atribuição-CompartilhaIgual 3.0 Não Adaptada. | ||
| ||
| Esta marca de licenciamento foi adicionada a este ficheiro durante a atualização da licença GFDL. |
Histórico do ficheiro
Clique uma data e hora para ver o ficheiro tal como ele se encontrava nessa altura.
| Data e hora | Miniatura | Dimensões | Utilizador | Comentário | |
|---|---|---|---|---|---|
| atual | 07h42min de 14 de março de 2019 | | 1 632 × 1 632 (366 kB) | Dragons flight | Some suggested tweaks in category labels |
| 12h04min de 13 de março de 2019 |  | 1 632 × 1 632 (366 kB) | Dragons flight | Updates diagram to use the EDGAR 4.2 FT2010 values for the year 2010 | |
| 17h36min de 23 de novembro de 2006 |  | 650 × 603 (33 kB) | Xiaowei | == Description == This figure shows the relative fraction of man-made greenhouse gases coming from each of eight categories of sources, as estimated by the Emission Database for Global Atmospheric Research version 3.2, fast track 2000 project [ht |
Utilização local do ficheiro
Não há nenhuma página que use este ficheiro.
Utilização global do ficheiro
As seguintes wikis usam este ficheiro:
- ar.wikipedia.org
- de.wikipedia.org
- en.wikipedia.org
- fa.wikipedia.org
- fr.wikipedia.org
- ga.wikipedia.org
- gu.wikipedia.org
- hi.wikipedia.org
- hr.wikipedia.org
- hu.wikipedia.org
- ja.wikipedia.org
- kn.wikipedia.org
- ko.wikipedia.org
- nl.wikipedia.org
- sh.wikipedia.org
- sl.wikipedia.org
- sq.wikipedia.org
- ta.wikipedia.org
- th.wikipedia.org
- vi.wikipedia.org
- zh-min-nan.wikipedia.org
- zh.wikipedia.org