
Ficheiro:1928 North Indian Ocean cyclone season summary map.png
Dimensões desta antevisão: 800 × 494 píxeis. Outras resoluções: 320 × 198 píxeis | 640 × 396 píxeis | 1 024 × 633 píxeis | 1 280 × 791 píxeis | 3 000 × 1 854 píxeis.
Imagem numa resolução maior (3 000 × 1 854 píxeis, tamanho: 4,21 MB, tipo MIME: image/png)
|
|
Esta imagem provém do Wikimedia Commons, um acervo de conteúdo livre da Wikimedia Foundation que pode ser utilizado por outros projetos.
|
| Descrição |
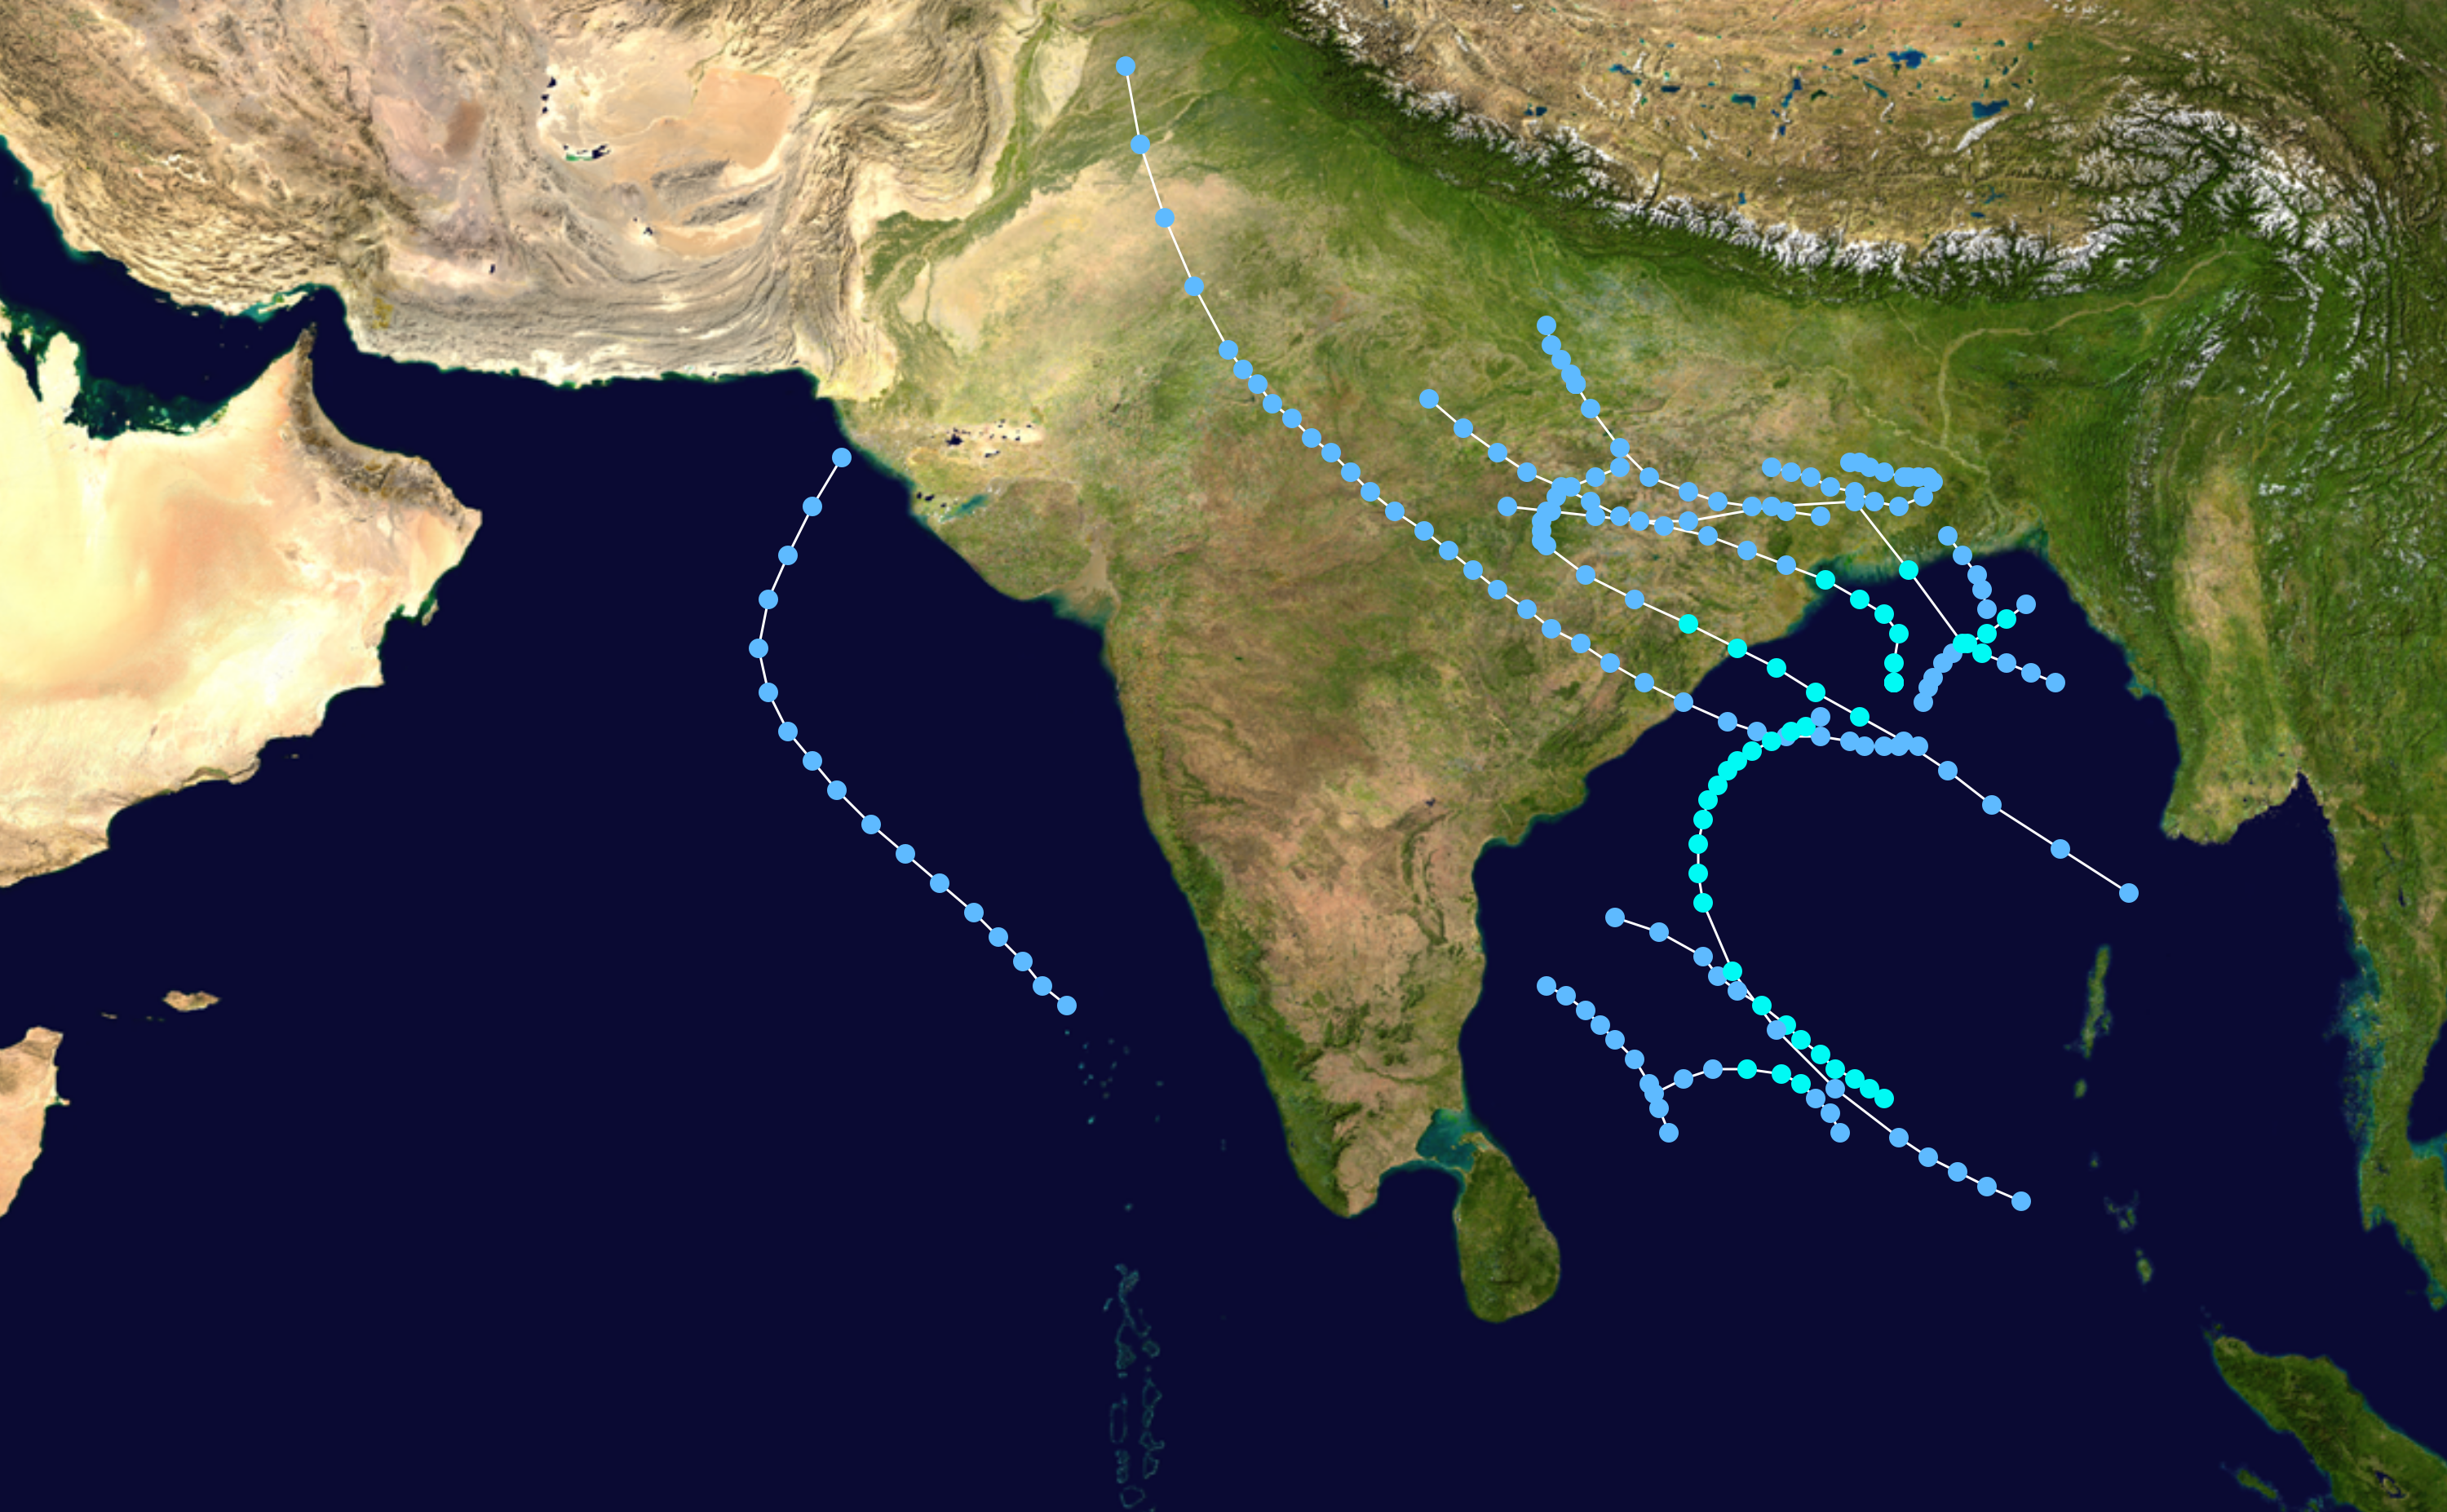
English: This map shows the tracks of all tropical cyclones in the 1928 North Indian Ocean cyclone season. The points show the location of each storm at 6-hour intervals. The colour represents the storm's maximum sustained wind speeds as classified in the Saffir-Simpson Hurricane Scale (see below), and the shape of the data points represent the type of the storm.
Tropical depression (≤38 mph, ≤62 km/h)
Tropical storm (39–73 mph, 63–118 km/h)
Category 1 (74–95 mph, 119–153 km/h)
Category 2 (96–110 mph, 154–177 km/h)
Category 3 (111–129 mph, 178–208 km/h)
Category 4 (130–156 mph, 209–251 km/h)
Category 5 (≥157 mph, ≥252 km/h)
Unknown
Storm type |
| Origem | Created using Wikipedia:WikiProject Tropical cyclones/Tracks. The background image is from NASA [1]. The tracking data from the International Best Track Archive for Climate Stewardship's Database Version 3 Revision 4. |
| Autor | Cyclonebiskit |
| Esta obra foi dedicada ao domínio público pelo autor, Cyclonebiskit, com aplicação em todo o mundo. Nalguns países isto pode não ser legalmente possível; se assim for: Cyclonebiskit concede a todos o direito de usar esta obra para qualquer fim, sem quaisquer condições, a menos que tais condições sejam impostas por lei. |
Histórico do ficheiro
Clique uma data e hora para ver o ficheiro tal como ele se encontrava nessa altura.
| Data e hora | Miniatura | Dimensões | Utilizador | Comentário | |
|---|---|---|---|---|---|
| atual | 13h13min de 15 de maio de 2013 | | 3 000 × 1 854 (4,21 MB) | Cyclonebiskit | =={{int:filedesc}}== {{Information |Description={{en|Track map of all cyclones during the 1928 North Indian Ocean cyclone season. The points show the location of the storm at 6-hour intervals. The colour rep... |
Utilização local do ficheiro
A seguinte página usa este ficheiro:
Utilização global do ficheiro
As seguintes wikis usam este ficheiro:
- en.wikipedia.org