
Ficheiro:Changing Face of the North America Nebula.jpg
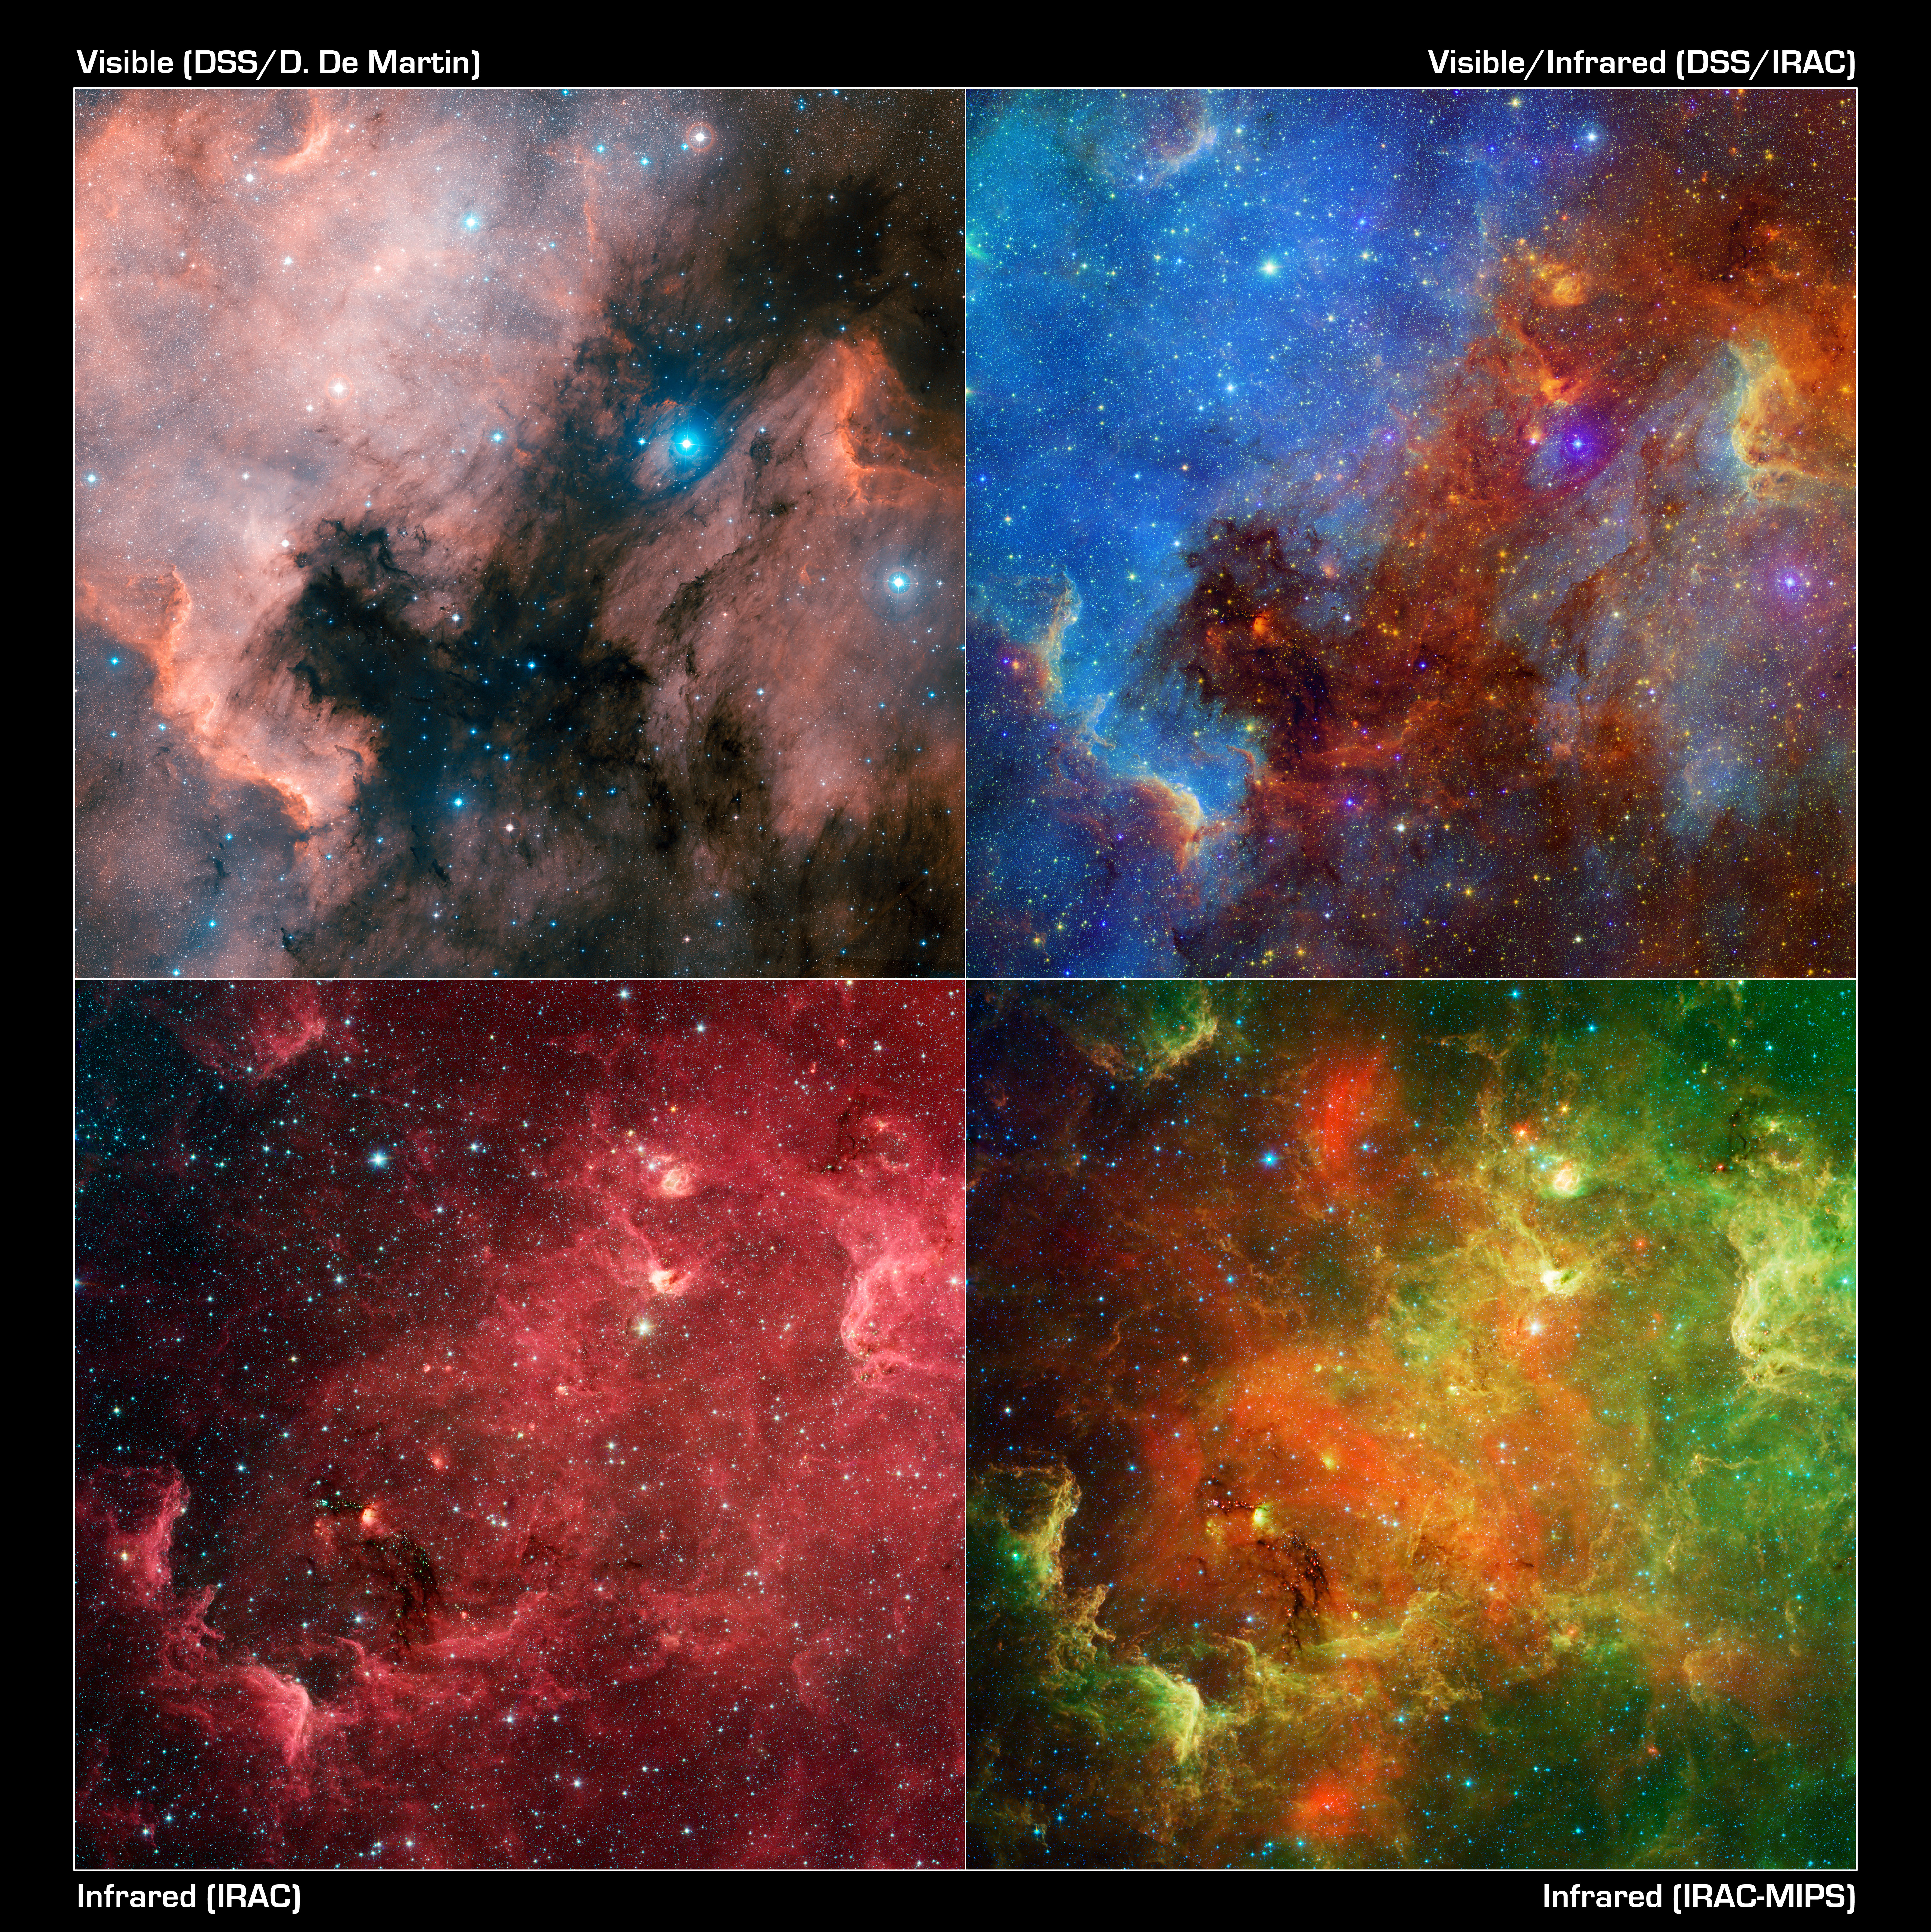
Imagem numa resolução maior (6 000 × 6 003 píxeis, tamanho: 16,93 MB, tipo MIME: image/jpeg)
|
|
Esta imagem provém do Wikimedia Commons, um acervo de conteúdo livre da Wikimedia Foundation que pode ser utilizado por outros projetos.
|
Descrição do ficheiro
| Descrição |
English: This layout of images reveals how the appearance of the North America nebula can change dramatically using different combinations of visible and infrared observations from the Digitized Sky Survey and NASA's Spitzer Space Telescope, respectively.
In this progression, the visible-light view (upper left) shows a striking similarity to the North America continent. Each is cropped to the easterly bulk (thus also the quasi-"Gulf of Mexico" region). The red region to the right is known as the "Pelican nebula," after its resemblance in visible light to a pelican. The view at upper right includes both visible and infrared observations. The hot gas comprising the North America continent and the Pelican now takes on a vivid blue hue, while red colours display the infrared light. Inky black dust features start to glow in the infrared view. In the bottom two images, only infrared light from Spitzer is shown -- data from the infrared array camera is on the left, and data from both the infrared array camera and the multi-band imaging photometer, which sees longer wavelengths, is on the right. These pictures look different in part because infrared light can penetrate dust whereas visible light cannot. Dusty, dark clouds in the visible image become transparent in Spitzer's view. In addition, Spitzer's infrared detectors pick up the glow of dusty cocoons enveloping baby stars. |
| Data | |
| Origem | NASA JPL |
| Autor | NASA/JPL-Caltech/L. Rebull (SSC/Caltech) |
| Outras versões |

Colour is used to display different parts of the spectrum in each of these images. In the visible-light view (upper right) from the Digitized Sky Survey, colours are shown in their natural blue and red hues. The combined visible/infrared image (upper left) shows visible light as blue, and infrared light as green and red. The infrared array camera (lower left) represents light with a wavelength of 3.6 microns as blue, 4.5 microns as green, 5.8 microns as orange, and 8.0 microns as red. In the final image, incorporating the multi-band imaging photometer data, light with a wavelength of 3.6 microns has been colour coded blue; 4.5-micron light is blue-green; 5.8-micron and 8.0-micron light are green; and 24-micron light is red.
Licenciamento
| Este ficheiro está no domínio público nos Estados Unidos porque foi criado exclusivamente pela NASA. As orientações sobre o direito de autor da NASA são que «as obras da NASA não têm os direitos de autor protegidos salvo indicação em contrário». Veja Template:PD-USGov, as orientações sobre o direito de autor da NASA ou as normas de uso de imagens do Laboratório de Propulsão a Jato (Jet Propulsion Lab, JPL). | ||
 |
Avisos:
|
| Anotações | Esta imagem está anotada: Ver as anotações na wiki Commons |
Histórico do ficheiro
Clique uma data e hora para ver o ficheiro tal como ele se encontrava nessa altura.
| Data e hora | Miniatura | Dimensões | Utilizador | Comentário | |
|---|---|---|---|---|---|
| atual | 12h09min de 16 de fevereiro de 2011 | | 6 000 × 6 003 (16,93 MB) | Originalwana | {{Information |Description ={{en|1=This image layout reveals how the appearance of the North America nebula can change dramatically using different combinations of visible and infrared observations from the [[:Category:Digitized |
Utilização local do ficheiro
A seguinte página usa este ficheiro:
Utilização global do ficheiro
As seguintes wikis usam este ficheiro:
- ar.wikipedia.org
- cs.wikipedia.org
- fr.wikipedia.org
- mk.wikipedia.org
- my.wikipedia.org
- pl.wikipedia.org
- th.wikipedia.org
- vi.wikipedia.org
- zh.wikipedia.org