
Ficheiro:Global tropical cyclone tracks.jpg
Dimensões desta antevisão: 800 × 400 píxeis. Outras resoluções: 320 × 160 píxeis | 640 × 320 píxeis | 1 024 × 512 píxeis | 1 280 × 640 píxeis | 2 560 × 1 280 píxeis | 8 000 × 4 000 píxeis.
Imagem numa resolução maior (8 000 × 4 000 píxeis, tamanho: 6,55 MB, tipo MIME: image/jpeg)
|
|
Esta imagem provém do Wikimedia Commons, um acervo de conteúdo livre da Wikimedia Foundation que pode ser utilizado por outros projetos.
|
| Descrição |
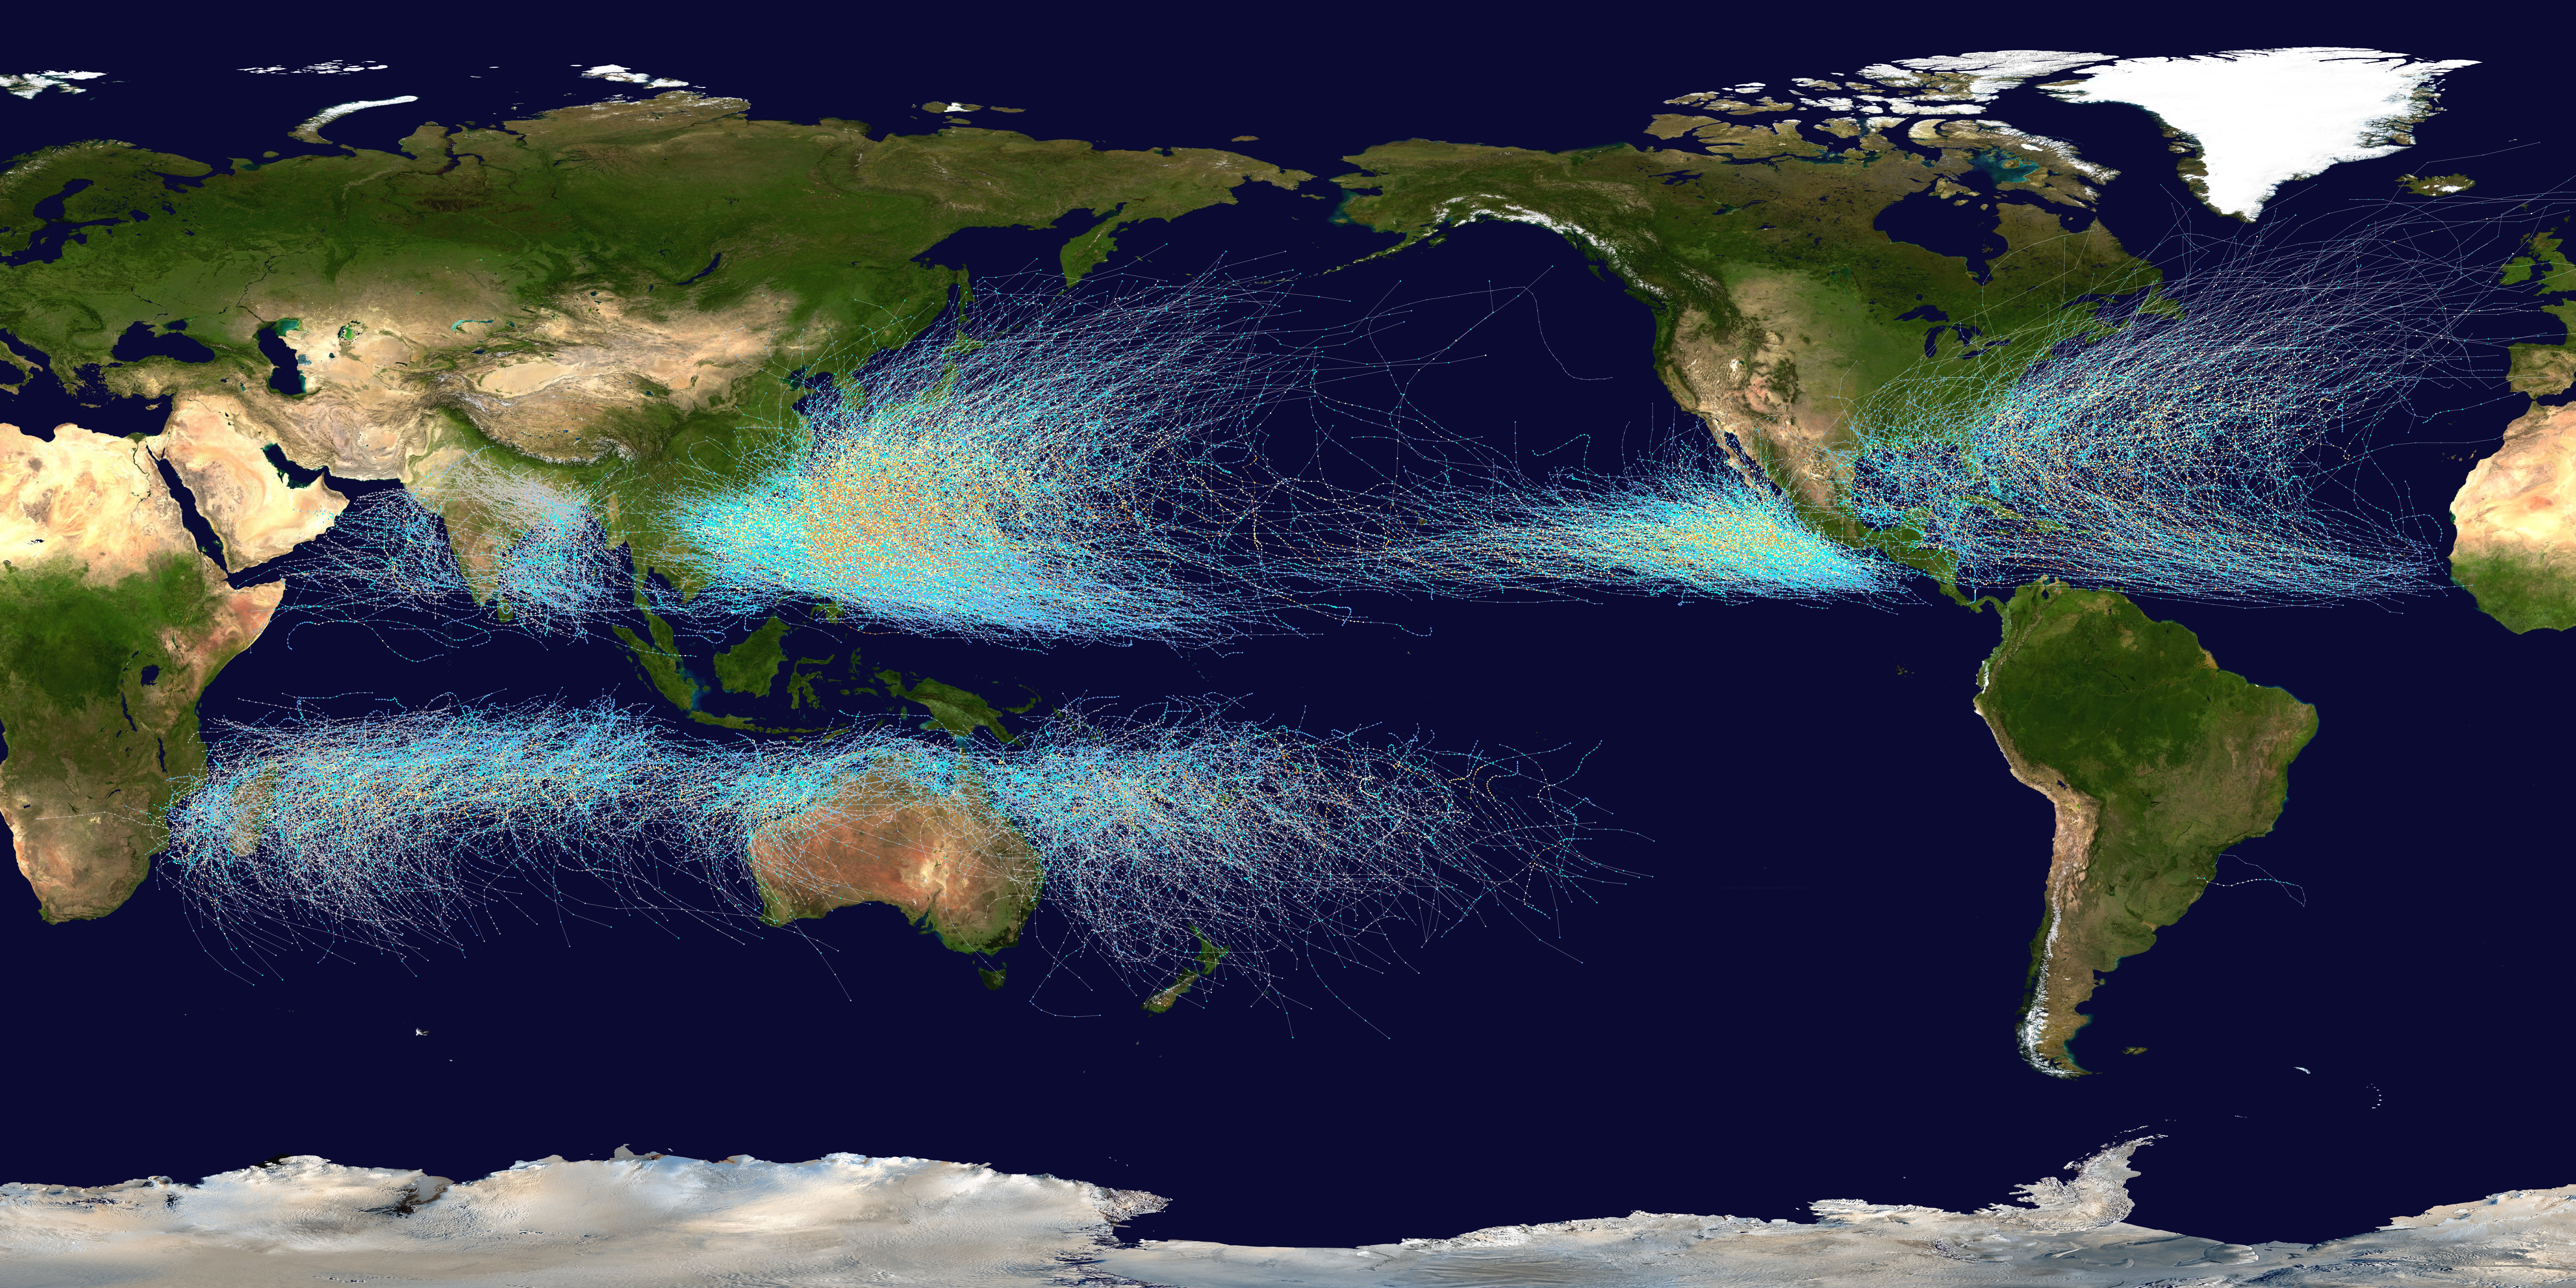
English: This trackmap shows the tracks of all tropical cyclones which formed worldwide from 1950 to 2005.. The points show the location of each storm at 6-hour intervals. The colour represents the storm's maximum sustained wind speeds as classified in the Saffir-Simpson Hurricane Scale (see below), and the shape of the data points represent the nature of the storm.
Tropical depression (≤38 mph, ≤62 km/h)
Tropical storm (39–73 mph, 63–118 km/h)
Category 1 (74–95 mph, 119–153 km/h)
Category 2 (96–110 mph, 154–177 km/h)
Category 3 (111–129 mph, 178–208 km/h)
Category 4 (130–156 mph, 209–251 km/h)
Category 5 (≥157 mph, ≥252 km/h)
Unknown
Storm type |
| Data | 1950–2005 |
| Origem | Created using Wikipedia:WikiProject Tropical cyclones/Tracks. The background image is from NASA [1]. The tracking data for the Atlantic and Eastern Pacific basins is taken from the National Hurricane Center and the Central Pacific Hurricane Center's Northeast and North Central Pacific hurricane database. The tracking data for storms in the Indian Ocean, the Northwest Pacific and the Southern Pacific is from the Joint Typhoon Warning Center. Tracking data for Cyclone Catarina in the South Atlantic was published in Gary Padgett's April 2004 Monthly Tropical Cyclone Summary and was originally produced by Roger Edson of the University of Guam. |
| Autor | Nilfanion |
| Esta obra foi dedicada ao domínio público pelo autor, Nilfanion, com aplicação em todo o mundo. Nalguns países isto pode não ser legalmente possível; se assim for: Nilfanion concede a todos o direito de usar esta obra para qualquer fim, sem quaisquer condições, a menos que tais condições sejam impostas por lei. |
Histórico do ficheiro
Clique uma data e hora para ver o ficheiro tal como ele se encontrava nessa altura.
| Data e hora | Miniatura | Dimensões | Utilizador | Comentário | |
|---|---|---|---|---|---|
| atual | 21h27min de 31 de julho de 2006 | | 8 000 × 4 000 (6,55 MB) | Nilfanion | High-resolution version, including Catarina |
| 12h02min de 12 de julho de 2006 |  | 8 191 × 4 121 (6,93 MB) | Nilfanion | == Summary == This map shows the tracks of all {{w|Tropical cyclone}}s for which best track data is available. This includes: North Atlantic storms from 1851-2005, East Pacific storms from 1949-2005 and storms from 1945-2005 in all other basins. Uses the |
Utilização local do ficheiro
Não há nenhuma página que use este ficheiro.
Utilização global do ficheiro
As seguintes wikis usam este ficheiro:
- en.wikipedia.org
- simple.wikipedia.org
- zh.wikipedia.org