
Ficheiro:Mpl example Helmoltz coils.svg

Imagem numa resolução maior (ficheiro SVG, de 540 × 540 píxeis, tamanho: 63 kB)
|
|
Esta imagem provém do Wikimedia Commons, um acervo de conteúdo livre da Wikimedia Foundation que pode ser utilizado por outros projetos.
|
Descrição do ficheiro
| Descrição |
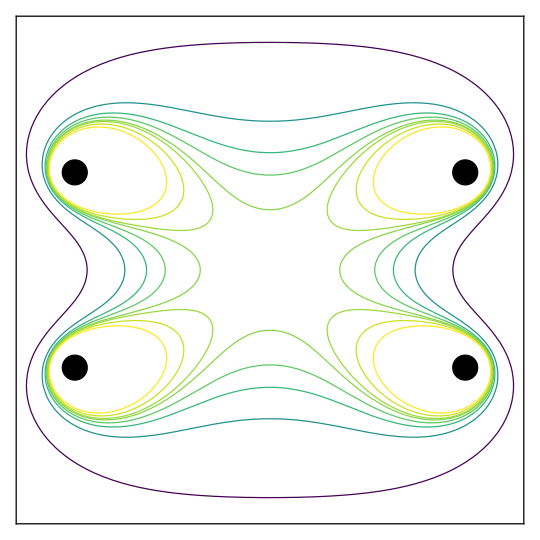
English: Cross section of B (magnetic field strength) magnitude in a Helmholtz coil (actually consisting of two coils: one at the top, one at the bottom in the plot). The eight contours are for field magnitudes of 0.5 {\displaystyle B_0}, 0.8 {\displaystyle B_0}, 0.9 {\displaystyle B_0}, 0.95 {\displaystyle B_0}, 0.99 {\displaystyle B_0}, 1.01 {\displaystyle B_0}, 1.05 {\displaystyle B_0}, and 1.1 {\displaystyle B_0}, where {\displaystyle B_0} is field strength at center. The large center area has almost uniform field strength. |
| Data | |
| Origem | Obra do próprio |
| Autor | Adrien F. Vincent |
| SVG desenvolvimento | O código-fonte desta imagem SVG é válido. Este(a) desenho vetorial foi criado com o Matplotlib |
Rationale: this work aims at providing an up-to-date version of the similar work https://commons.wikimedia.org/wiki/File:Helmholtz_coil,_B_magnitude_cross_section.svg, done by Morn.
Source code has been modified into fully object-oriented matplotlib interface. It now uses the "viridis" colormap, instead of "jet" which produces perceptual glitches. Besides, some changes had to be done to work with versions of numpy more recent than the one originally used.
The matplotlib (mpl) version is 1.5.3, with Python 2.7 and numpy 1.10
##########
## Code for the figure
##########
# -*- coding: utf-8 -*-
from __future__ import division

import matplotlib.pyplot as plt
import numpy as np

from matplotlib.cm import viridis as colormap  # future default colormap

"""
Setup
"""
r = 1.0
res = 200  # grid resolution. 100 may be enough, resulting in smaller SVG file)

def dist3(a, b, c, d, e, f):
    """Compute the Euclidian distance from (d, e, f) to (a, b, c),
    raised to the 3rd power (and with lower boundary `r`).
    """
    return np.maximum(r, np.sqrt((a - d)**2 + (b - e)**2 + (c - f)**2))

x = np.linspace(-150, 150, res)
y = np.linspace(-150, 150, res)
X, Y = np.meshgrid(x, y)
F = np.zeros((res, res, 3))

"""
Computing part
"""
# Loop over two coils
for coils in [1.0, -1.0]:
    # Sum field contributions from coil in 10-degree steps
    for p in np.arange(0, 360, 10):
        xc = 100 * np.sin(np.pi * p / 180.0)
        yc = 50 * coils
        zc = 100 * np.cos(np.pi * p / 180.0)
        MAG = 1.0 / ((r + dist3(X, Y, 0.0, xc, yc, zc))**3)
        # (We leave out the necessary constants that would be required
        # to get proper units because only scaling behavior will be shown
        # in the plot. This is also why a sum instead of an integral
        # can be used.)
        #
        # Due to more stringent casting rules in recent Numpy (>=1.10),
        # one builds an explicit list of all the vectors (X - xc, Y - yc, -zc)
        # instead of relying on broadcasting. One then reshapes the array Z
        # (of the cross-product results) as previously expected.
        vectors = np.array([[xval - xc, yval - yc, -zc] for (xval, yval)
                            in zip(X.reshape(-1), Y.reshape(-1))])
        Z = np.cross(vectors, (-zc, 0.0, xc))
        Z = Z.reshape(res, res, 3)
        F += Z * MAG[:,:,np.newaxis]

# Compute the B-field
B = np.sqrt(F[..., 0]**2 + F[..., 1]**2 + F[..., 2]**2)
# Scale field strength by value at center
B = B / B[res // 2, res // 2]

"""
Plotting part
"""
fig_label = "helmoltz_coils"
plt.close(fig_label)
fig, ax = plt.subplots(figsize=(6, 6), num=fig_label, frameon=False)

levels = (0.5, 0.8, 0.9, 0.95, 0.99, 1.01, 1.05, 1.1)
cs = ax.contour(x, y, B, cmap=colormap, levels=levels)

# Add wire symbols
ax.scatter((100, 100, -100, -100), (50, -50, 50, -50), s=400, color="Black")

ax.axis((-130, 130, -130, 130))
ax.set_xticks([])
ax.set_yticks([])

plt.tight_layout()
plt.show()

fig.savefig("Helmholtz_coil,_B_magnitude_cross_section.svg")
##########
Licenciamento
- Pode:
- partilhar – copiar, distribuir e transmitir a obra
- recombinar – criar obras derivadas
- De acordo com as seguintes condições:
- atribuição – Tem de fazer a devida atribuição da autoria, fornecer uma hiperligação para a licença e indicar se foram feitas alterações. Pode fazê-lo de qualquer forma razoável, mas não de forma a sugerir que o licenciador o apoia ou subscreve o seu uso da obra.
- partilha nos termos da mesma licença – Se remisturar, transformar ou ampliar o conteúdo, tem de distribuir as suas contribuições com a mesma licença ou uma licença compatível com a original.
Histórico do ficheiro
Clique uma data e hora para ver o ficheiro tal como ele se encontrava nessa altura.
| Data e hora | Miniatura | Dimensões | Utilizador | Comentário | |
|---|---|---|---|---|---|
| atual | 09h52min de 27 de setembro de 2016 | | 540 × 540 (63 kB) | Adrien F. Vincent | User created page with UploadWizard |
Utilização local do ficheiro
A seguinte página usa este ficheiro:
Utilização global do ficheiro
As seguintes wikis usam este ficheiro:
- bn.wikipedia.org
- en.wikipedia.org
- ko.wikipedia.org
- tr.wikipedia.org
- zh.wikipedia.org